


<
>
Arizona Sky Island Birds
working together to assess wildfire and climate change effects
2012 Citizen Science Summary
2013 Citizen Science Summary
Fire Severity at Trail Points
2012 Citizen Science Summary
During the 2012 pilot study, citizen scientists detected 59 different species at 7 transects (44 total point count stations) by 8 observers. Approximately 49% of the original points were sampled during the pilot study. The most commonly detected species included:
Painted Redstart
Hepatic Tanager
Hermit Thrush
House Wren
Spotted Towhee
Black-throated Gray Warbler
Black-headed Grosbeak
American Robin
These common species were also detected at high frequencies during the RMRS study from the 90s. Based on these initial results from the 2012 pilot study, we saw utility in proceeding with data collection by citizen scientists for 2013 along trails in the same areas as our original transects. Avian community response to wildfire will change with time as vegetation changes and it is important to document this response over multiple years.
2013 Citizen Science Summary
During the 2013 trail pilot study, citizen scientists sampled 8 transects (61 total point count stations) with 8 observers. Approximately 97% of the possible trail points were sampled during the trail pilot study. There were 59 different species detected and the most commonly detected species included:
Mexican Jay
American Robin
Spotted Towhee
Black-throated Gray Warbler
Dusky-capped Flycatcher
Black-headed Grosbeak
Bewick’s Wren
Northern Flicker
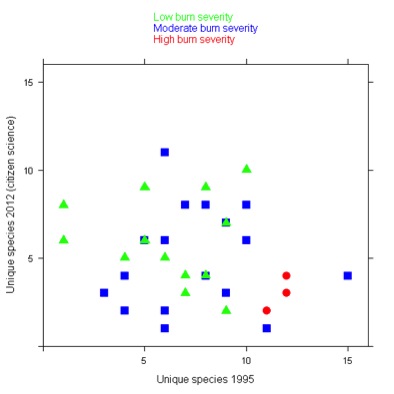
Fire Severity at Trail Points
Number of different species detected during one pass during 1995 (pre-fire) versus number of different species detected during the 2012 citizen science pilot study (post-fire). Burn severity at point count stations was classified as low/unburned, moderate, or high. Assuming no differences between observers or bird detection between years, the number of species detected would be comparable, unless the habitat changed. There were fewer species detected at points with high burn severity one year after the wildfire than low or moderate severity points compared to the same points during the pre-fire period. Note that this graph is for 36 points, not the full data set.

This work is licensed under a Creative Commons Attribution-NonCommercial-NoDerivatives 4.0 International License.